Chart Plotter of nfs-iostat output
Nowadays, many tools exist for graphing and monitoring and sometimes we need to build graphs from nfsiostat output file like in the good old days.
By default, the nfsiostat output does not contain a time-stamp in its iterations. Therefore, an interval (in seconds) is a mandatory input for nfsioplotter.py script. There are no computations made with the timeline except using it for x-axis in the charts.
The script produces four graphs (IOPS, Throughput, Request Size per operation and Average Round-Trip Time)
- NFS iostat data that looks like this:
1.2.3.4:/pg_db_data mounted on /db/nfspostgres_data: op/s rpc bklog 196.86 0.00 read: ops/s kB/s kB/op retrans avg RTT (ms) avg exe (ms) 8.195 414.453 50.576 0 (0.0%) 1.351 1.420 write: ops/s kB/s kB/op retrans avg RTT (ms) avg exe (ms) 38.824 500.058 12.880 0 (0.0% 2.991 20.793 1.2.3.4:/pg_db_wal mounted on /db/nfspostgres_wal: op/s rpc bklog 196.80 0.00 read: ops/s kB/s kB/op retrans avg RTT (ms) avg exe (ms) 48.818 347.395 7.116 0 (0.0%) 0.464 0.489 write: ops/s kB/s kB/op retrans avg RTT (ms) avg exe (ms) 90.651 1372.200 15.137 0 (0.0%) 0.815 0.881 -
The script will turn it into this:
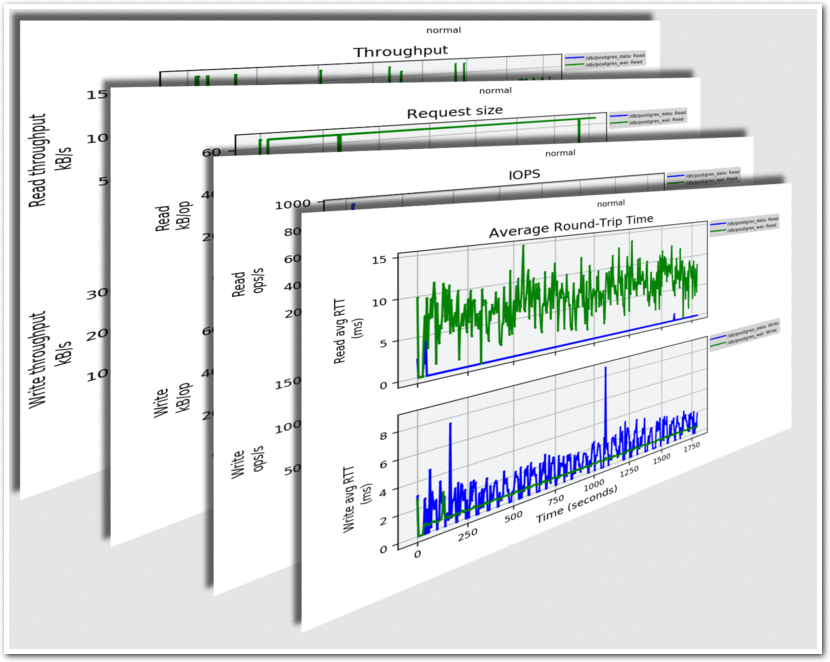
-
Prerequisites
- Python3 (should also work for python2.7)
- python3-matplotlib
- Execution switches and options
$ ./nfsioplotter.py -h usage: nfsioplotter.py [-h] [--devs dev [dev ...]] [--format ext] [--devlist] [--header title] [--debug] input interval Plot NFS iostat data. positional arguments: input nfs-iostat file. interval Interval in seconds. optional arguments: -h, --help show this help message and exit --devs dev [dev ...] Select NFS mounts to graph (partial names suffice). --format ext png, ps, eps, svg, pdf and onepdf. (default: png) onepdf: produces one file that contains all charts. --devlist List the devices. --header title Title that appears at the top of each chart. --debug Run with debug output. - List device names from the provided nfsiostat output file
$ ./nfsioplotter.py nfsiostat.txt 5 --devlist /db/postgres_archivelog /db/postgres_data /db/postgres_wal /db/postgres_backup /db/postgres_config - Plot all devices
$ ./nfsioplotter.py nfsiostat.txt 5 - Plot a couple of devices with a title
$ ./nfsioplotter.py nfsiostat.txt 5 --devs data wal --header normal -
Example of plotting all devices except one
$ ./nfsioplotter.py nfsiostat.txt 5 --devs $(./nfsioplotter.py nfsiostat.txt 5 --devlist|grep -v backup) - Plot a couple of devices and save to multi-page pdf document
$ ./nfsioplotter.py nfsiostat.txt 5 --devs data wal --format onepdf
Tips
-
Joining graphs side-by-side for easy comparision
for i in avgrtt iops requestsize throughput do convert dataset1/2931_${i}.png dataset2/14802_${i}.png +append ${i}.png done- With the help of
imagemagicktoolsudo apt install imagemagick-6.q16
- With the help of